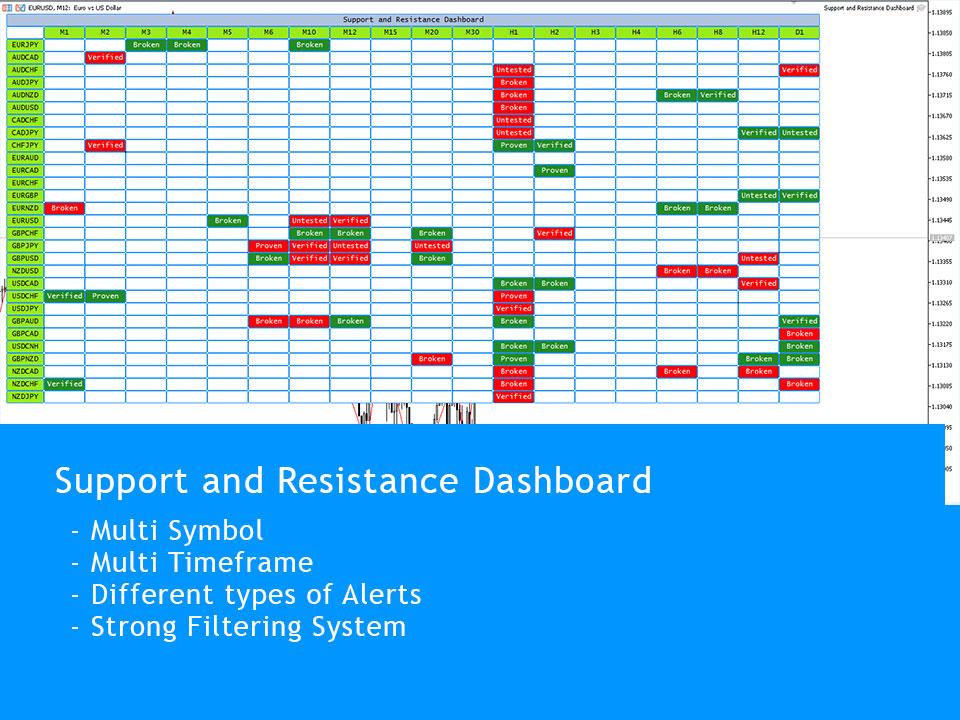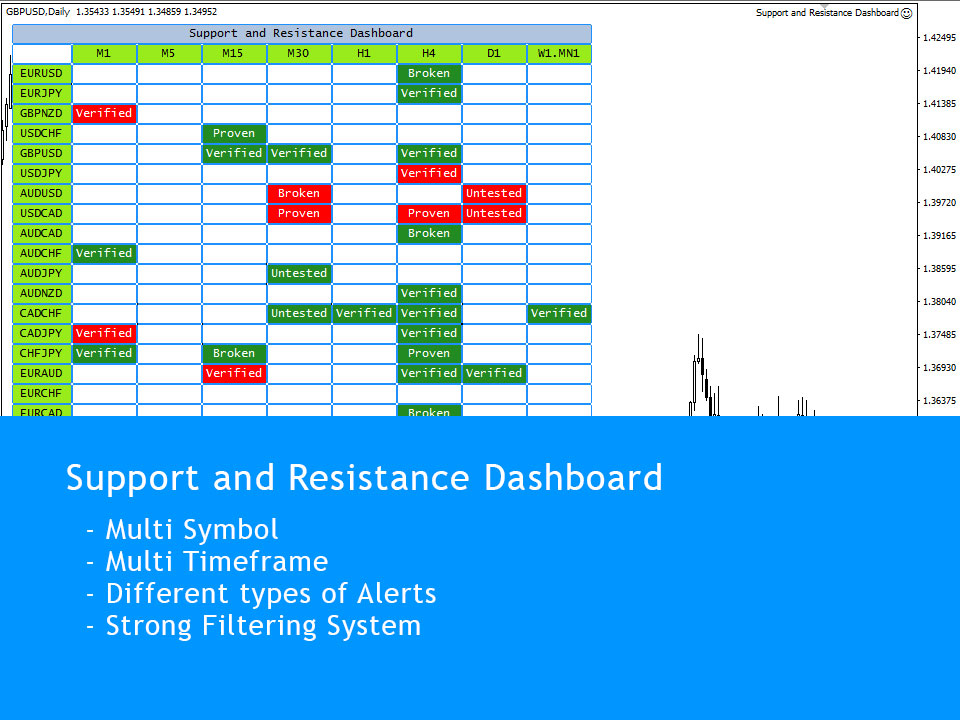
Support and Resistance Dashboard is a multi-timeframe and multi-symbol Scanner and alert that checks all timeframes and symbols to see if the price is inside the support and resistance zones.
If you are using support and resistance (or supply and demand) zones in your trading strategy, this dashboard and its alert and filtering system is a big time saver for you.
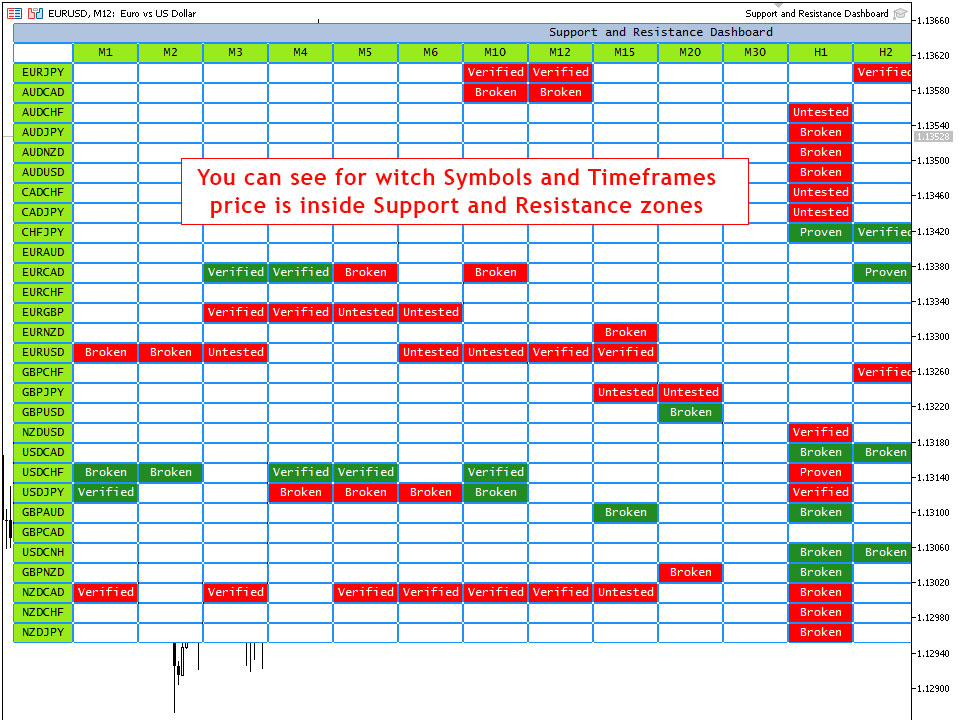
Also, if you are using other trading strategies, you can use this dashboard to avoid getting caught in support and resistance zones. Dashboard shows if the price is in S/R zones without the need to manually check all timeframes.
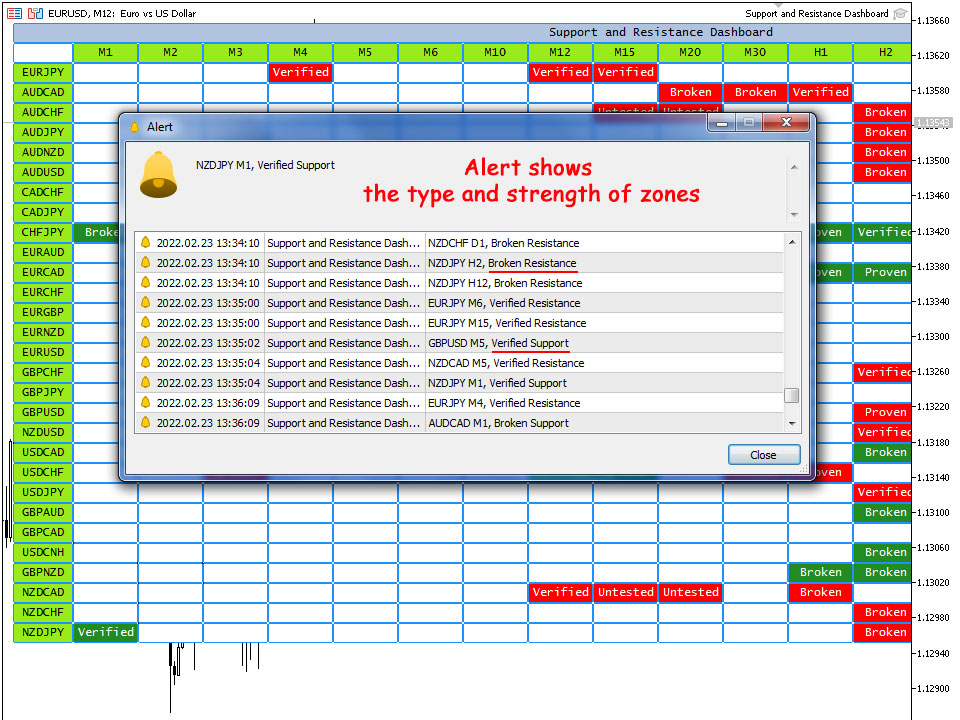
You don't need any more checking different symbols timeframes to see if the price is inside the Support and resistance zones, just run the dashboard and check the chart when an alert happens (you can select symbols and timeframes that you want to receive alerts).
To see how dashboard works please download the free DEMO version (works on M4,M6,M12,H3,H8,W1 timeframes of all symbols) from the bottom of the descriptions.
You can read the full description of adshboard parameters in the help page.
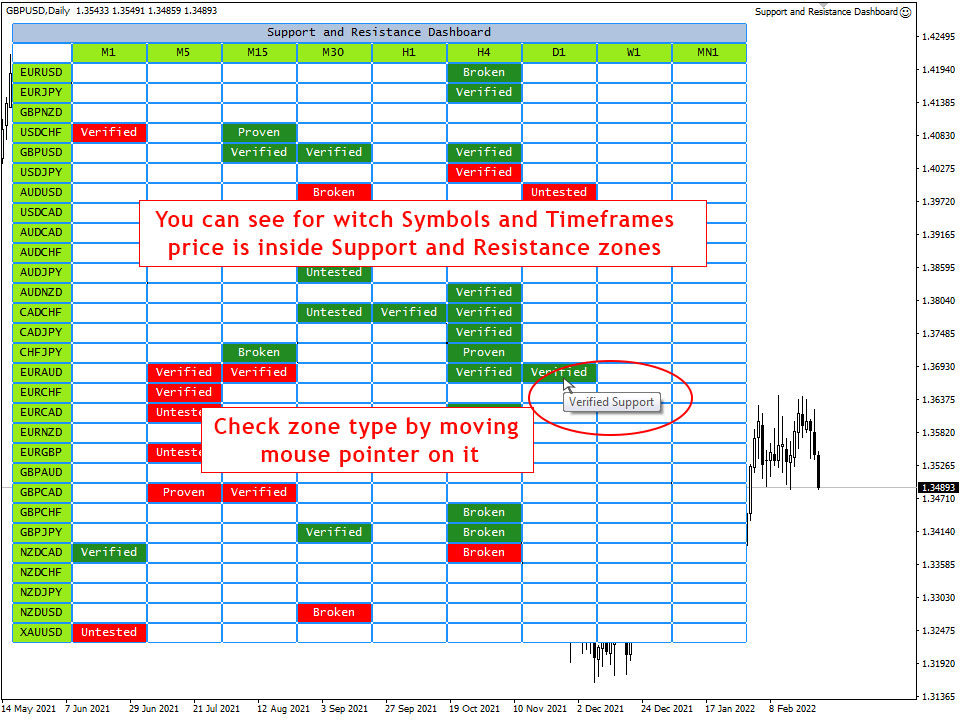
Informative Dashboard:
- Dashboard shows if price has interaction with support and resistance zones from M1 to W1 timeframes for all defined symbols.
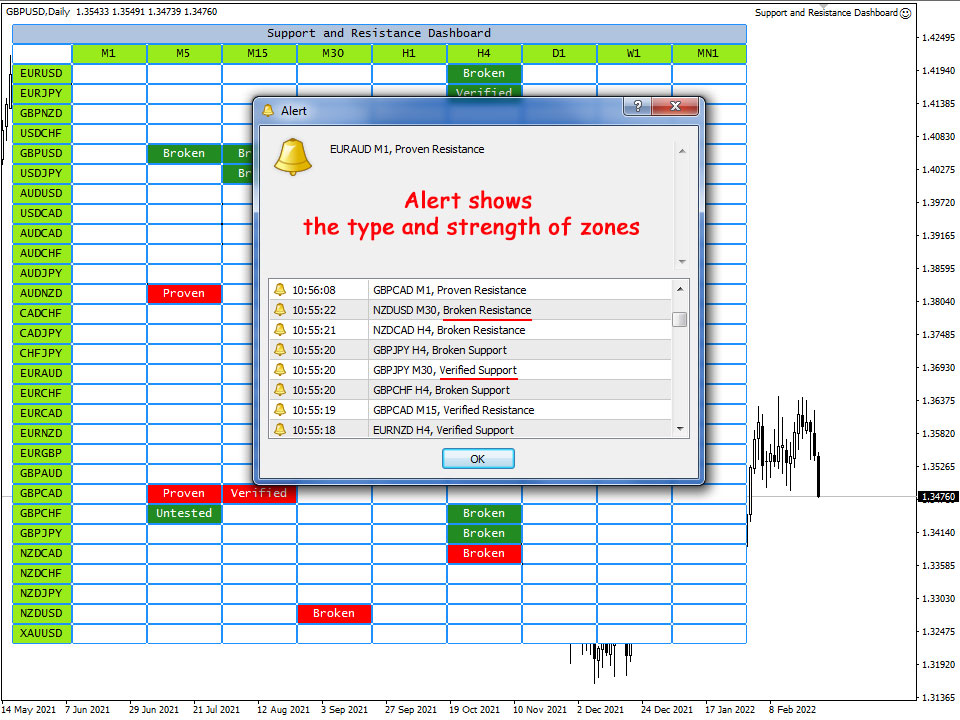
- Cell text shows the strength of support and resistance zones and the cell color shows the type of support and resistance zone.
Dashboard shows Strengths of Support and Resistance Zones:
Zones have different strengths that are:
- weak: Important high and low points in trend
- untested: major turning points in price chart that price still didn't touch them again
- verified: strong zones, price touched them before but couldn't break them
- proven: verified zone that at least four times the price can't break it
- broken: zones that price breaks them (not applied for weak zones)
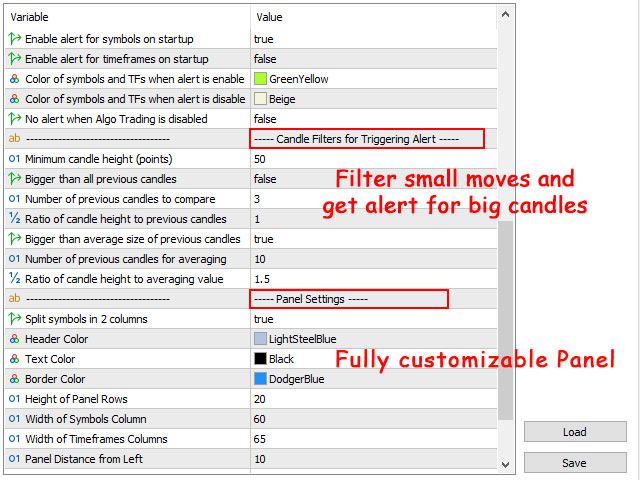
Powerful candle filters:
Dashboard has 3 types of customizable filters to ignore alerts for small candles.These filters are based on:
- the height of the candle
- comparison of the height of candle with the height of the previous candles
- comparison of the body of candle with the average body of the previous candle
Features:
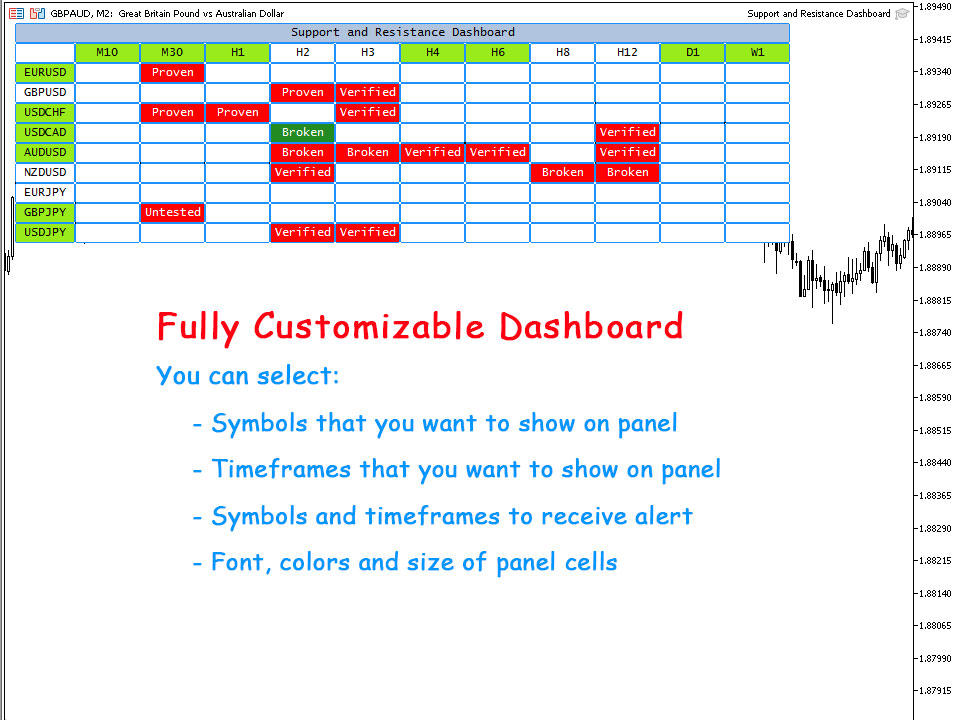
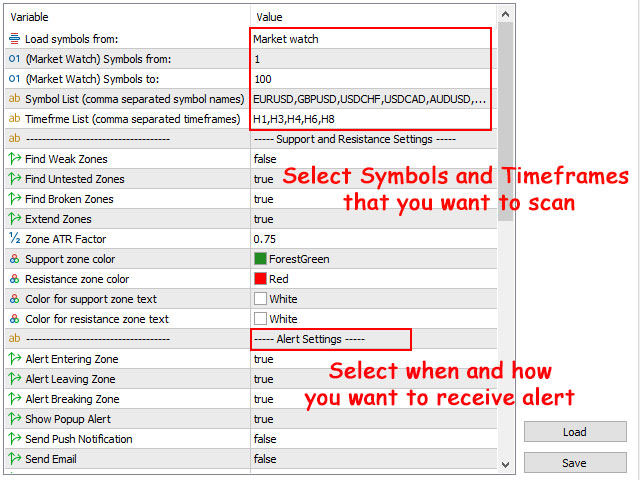
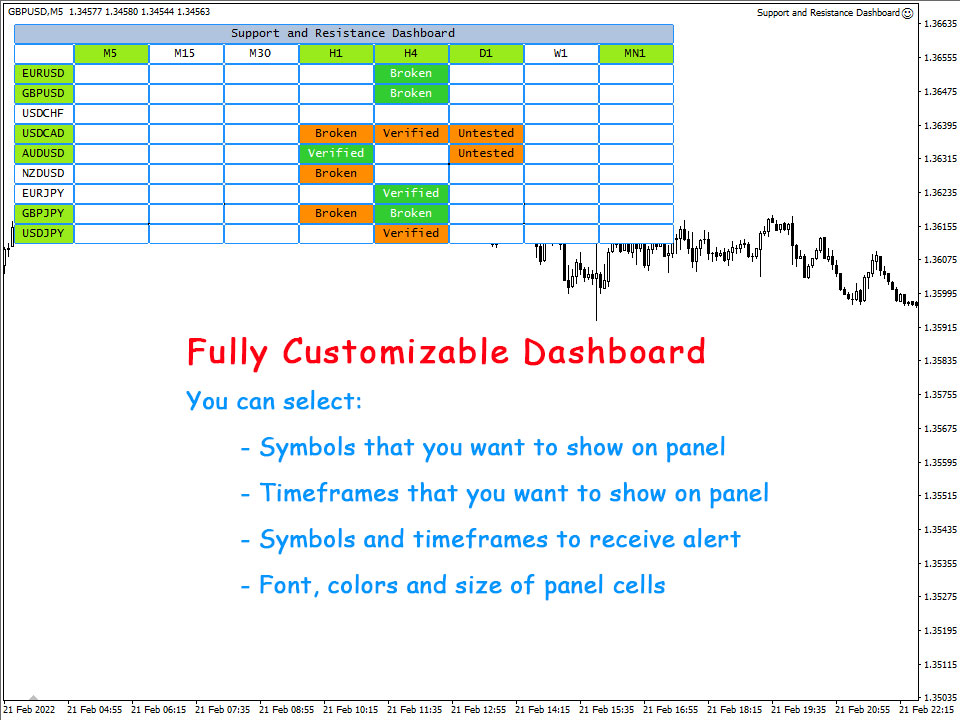
- You can set the parameters for support and resistance zones in dashboard input parameters.
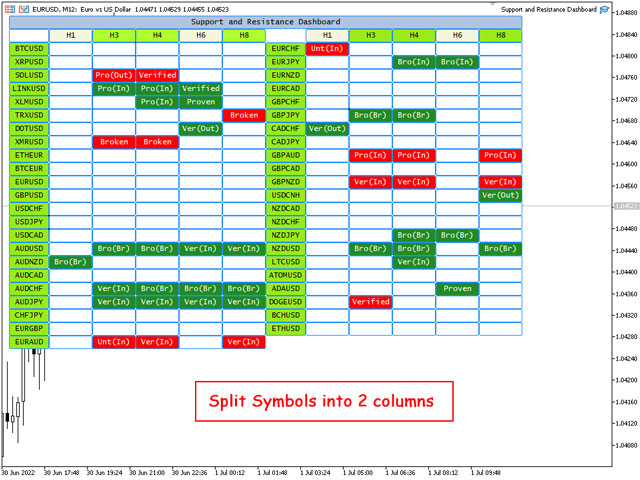
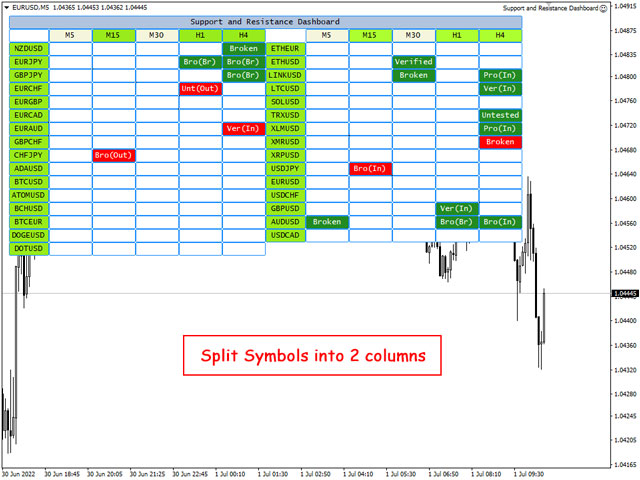
- You can split the symbols into 2 columns to show more symbols on the chart.
- You can separate symbols into multiple dashboards with different parameters for each dashboard (for example, for different markets).
- There are a full set of parameters for customizing the appearance of the panel.
- You can enable/disable alerts for symbols and timeframes directly from the dashboard.
- Dashboard works for all markets and for all symbols, you can write the symbol names in the settings (comma separate) or simply set the dashboard to read the symbols from the market watch.
Different Alert Types:
- Show Pop Up Alert: Show alert window when alert triggers.
- Send Push Notification: Send push notification to mobile phone when alert triggers. (You should set metatrader Notifications options)
- Send Email: Send email when alert triggers. (You should set metatrader Email options)
Notes:
- Panel and zones are updated every 1-minute candle open.
- Dashboard finds support and resistance zones based on shevd supply and demand indicator that you can download for free from https://www.mql5.com/en/code/29395
If you have any question, please ask in comments section. I'll do my best to answer your questions.
Satisfied with the demo version?
Metatrader 5 images: